Airline Financial Performance Report Q3 2016
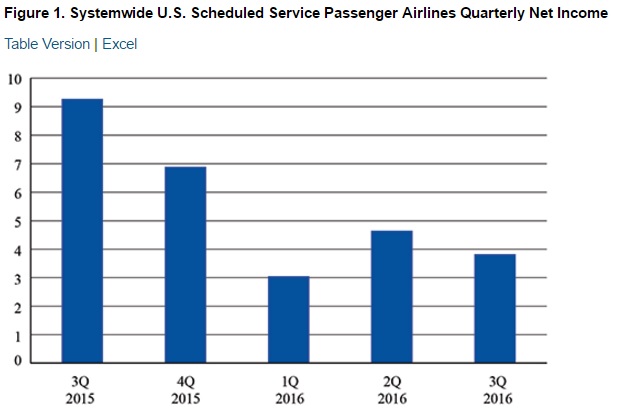
Airline Financial Performance Report Q3 2016 – The 25 U.S. scheduled service passenger airlines reported an after-tax net profit as a group for the 14th consecutive quarter. In addition to the after-tax net profit of $3.8 billion based on net income reports, the scheduled service passenger airlines reported a $7.2 billion pre-tax operating profit in the third quarter of 2016, down from $7.9 billion in the second quarter of 2016 and down from $8.8 billion in the third quarter of 2015. The airlines reported a pre-tax operating profit – as a group – for the 22nd consecutive quarter. Net profit or loss and operating profit or loss are two different measures of airline financial performance. Net profit or loss includes non-operating income and expenses, nonrecurring items or income taxes. Operating profit or loss is calculated from operating revenues and expenses before taxes and other nonrecurring items.
- Total operating revenue for all U.S. passenger airlines in the July-September third-quarter of 2016 was $44.4 billion. Airlines collected $33.3 billion from fares, 75.1 percent of total third-quarter operating revenue.
Total operating expenses for all passenger airlines in the third-quarter of 2016 were $37.2 billion, of which fuel costs accounted for $6.1 billion, or 16.4 percent, and labor costs accounted for $12.7 billion, or 34.3 percent. - In the third quarter, passenger airlines collected a total of $1.1 billion in baggage fees, 2.5 percent of total operating revenue, and $731 million from reservation change fees, 1.7 percent of total operating revenue. Fees are included for calculations of net income, operating revenue and operating profit or loss.
- Baggage fees and reservation change fees are the only ancillary fees paid by passengers that are reported to BTS as separate items. Other fees, such as revenue from seating assignments and on-board sales of food, beverages, pillows, blankets, and entertainment are combined in different categories and cannot be identified separately.
- From domestic operations, U.S. scheduled passenger airlines reported an after-tax net profit of $2.6 billion in the third quarter of 2016, down from $3.3 billion in the second quarter of 2016 and down from $5.7 billion in the third quarter of 2015.
In addition to the after-tax net profit of $2.6 billion based on net income reports, the scheduled service passenger airlines reported a $5.4 billion pre-tax operating profit from domestic operations in the third quarter of 2016, down from $6.1 billion in the second quarter of 2016 and down from $6.2 billion in the third quarter of 2015. The airlines reported a pre-tax operating profit from domestic operations – as a group – for the 22nd consecutive quarter.
From international operations, U.S. scheduled passenger airlines reported an after-tax net profit of $1.2 billion in the third quarter of 2016, down from $1.3 billion in the second quarter of 2016 and down from $3.6 billion in the third quarter of 2015.
The 17 U.S. scheduled service passenger airlines that operate internationally reported an after-tax net profit from international operations as a group for the seventh consecutive quarter.
In addition to the after-tax net profit of $1.2 billion based on net income reports, the scheduled service passenger airlines reported a $1.8 billion pre-tax operating profit from international operations in the third quarter of 2016, unchanged from $1.8 billion in the second quarter of 2016 and down from $2.6 billion in the second quarter of 2015. The airlines reported a pre-tax operating profit from international operations – as a group – for the 18th consecutive quarter.
Source: BTS Airline Financials Release


